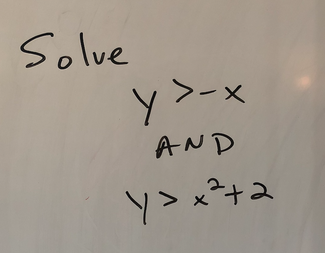
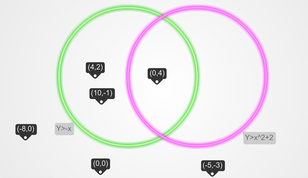
 One of the concepts we have been studying in my freshmen math class is solving systems of inequalities, such as the system seen below. In the past, the lesson would go something like this: 1) I would model how to draw each curve in the system. 2) I would draw dashed or solid lines and explain why they were dashed or solid. 3) I would shade the appropriate region and explain how to determine this. 4) I would ask if there were any questions and would address them with each student directly. 5) I would give the students a different, but very similar example to do and monitor their progress. At the end of this lesson, students could claim that they knew how to solve a system of inequalities by simply replicating the steps that I gave them in class. I really wouldn't allow much variation in the procedure - I had the math degree, after all, and I told the students that we all need to be on the same page as far as the 'right' way to do this procedure. This approach made me think of some of the belief sets that are discussed in the Expectations chapter in "Creating Cultures of Thinking: The 8 Forces We Must Master to Truly Transform Our Schools." The belief sets, which are outlined as natural tensions, that came to mind for this lesson are focusing on the learning vs. the work, teaching for understanding vs. knowledge, and encouraging deep vs. surface learning. As I reflected on the way that I used to teach this, I imagined that the students had the knowledge of how to graph an inequality, that they knew how to complete the work required (especially given the fact that I would assign a bunch of these types of problems for homework), and they at least had developed learning on a surface level. Obviously, these are not bad things in and of themselves, but how could we develop a deep level understanding of learning that was meaningful? I attempted to do this with the following lesson. I started class by displaying the problem above. I asked them to draw the solution on their desk (their desks are white boards) using whatever prior knowledge they could remember. There were definitely some cob webs as the students tried to remember what they had learned previously. A lot of discussion ensued: 'how do you draw this parabola?', 'I remember having to use dashed lines - do we do that here?', 'is shading a thing with these problems?', 'I think we shade everything, don't we?' It was tempting at this point to walk around and quickly check these for the kids and tell them right or wrong. It certainly would have made the lesson go faster, but in trying to foster independence I tried something different. I had the students check in with their group members (the students are in groups of 4) to compare and contrast their graphs and to come to an agreement on what was correct. Then, they had to erase the four graphs and create one that the group could agree on and draw that one rendition. In my classroom there are eight groups of four, so at the end of this there were eight graphs total. Each group collaborated, questioned, erased, shaded, and played until they were happy with their final product. I then had the groups rotate around the classroom. Each group was instructed to carry one marker and to 'annotate' the final product at each group. If they saw something that somebody else had already written, they had to put a star next to it. After a slew of rotations around the class, everybody came back to their home group and were able to see the comments, suggestions, fixes and feedback that were left at their table. I gave them a few minutes to digest everything that they saw. 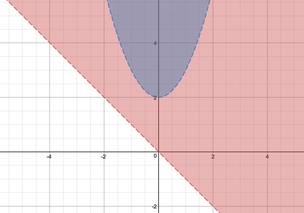 I then put up the following drawing using desmos. I asked them to compare what they had with what they saw from desmos and to write down what they were wondering about. Here are some samples: - is the blue and the red region necessary? - is the white region part of the answer? - i still don't understand the dashed lines - is desmos right or am I right? I asked the class "Which region is the correct region? Is it the blue, the red, both of these, or the white? Many students chose blue, some chose red, while some chose both. I called their attention to the fact that in the original system, the word "AND" was used, which in math means intersection. 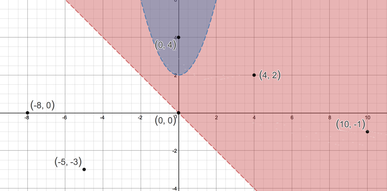 I then showed them the same graph in desmos, except now with some points plotted in the different regions. I asked students that were comfortable to go and plot more points in the various regions, so they slowly went up and put more points on the screen. Instead of asking which color regions were the solutions, I asked which points were the solutions to this problem. Many students mentioned the point (0,4), as well as others that were in the blue, but some still called out points (4,2), and (10,-1) in the red region. 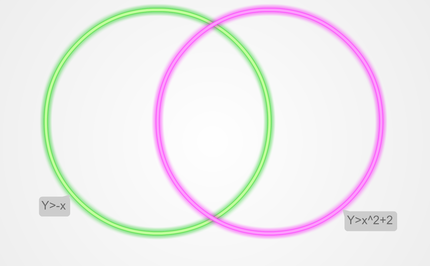 At this point, I displayed the following Venn diagram on the board. I asked them to draw this Venn Diagram on their desk and to place the coordinate points in the appropriate places in the Venn diagram. They had been exposed to Venn diagrams in the past, and for the most part knew that the AND part was the portion in the middle of the diagram. They slowly started placing points in various spots on the diagram, and were trying to figure exactly where the coordinates would fit. However, the most fun occurred when I asked each group to create their own systems. They could include any functions that they were familiar with as long as they had general knowledge of how to draw them. This was fun to see develop as some groups created a system with a line and quadratic (just like mine!) and I told them to go back to the drawing board and make it a bit more interesting. One group brainstormed a list of the functions they were familiar with before choosing. Still another group picked three functions instead of two. Regardless, the kids came up with much better examples and insight than I could have, and it certainly was much more rich than me just handing them a system to solve!
The eight new systems served as a springboard for more practice. I gave the students a choice on which systems they wanted to tackle, and when they wanted to tackle them, whether it be at home, during class, or after school.
1 Comment
|
Archives
February 2021
Categories
All
AuthorJeff Watson is a Math teacher at the University Liggett School in Grosse Pointe Woods, MI. His work as a software engineer made him realize the need for problem solvers and critical thinkers in the workplace today. Jeff believes that the secondary math classroom should be a place of critical thinking, collaborative learning, and exploration which will cultivate the problem solvers and thinkers needed today. |

 RSS Feed
