|
This blog is re-posted from November, 2017.
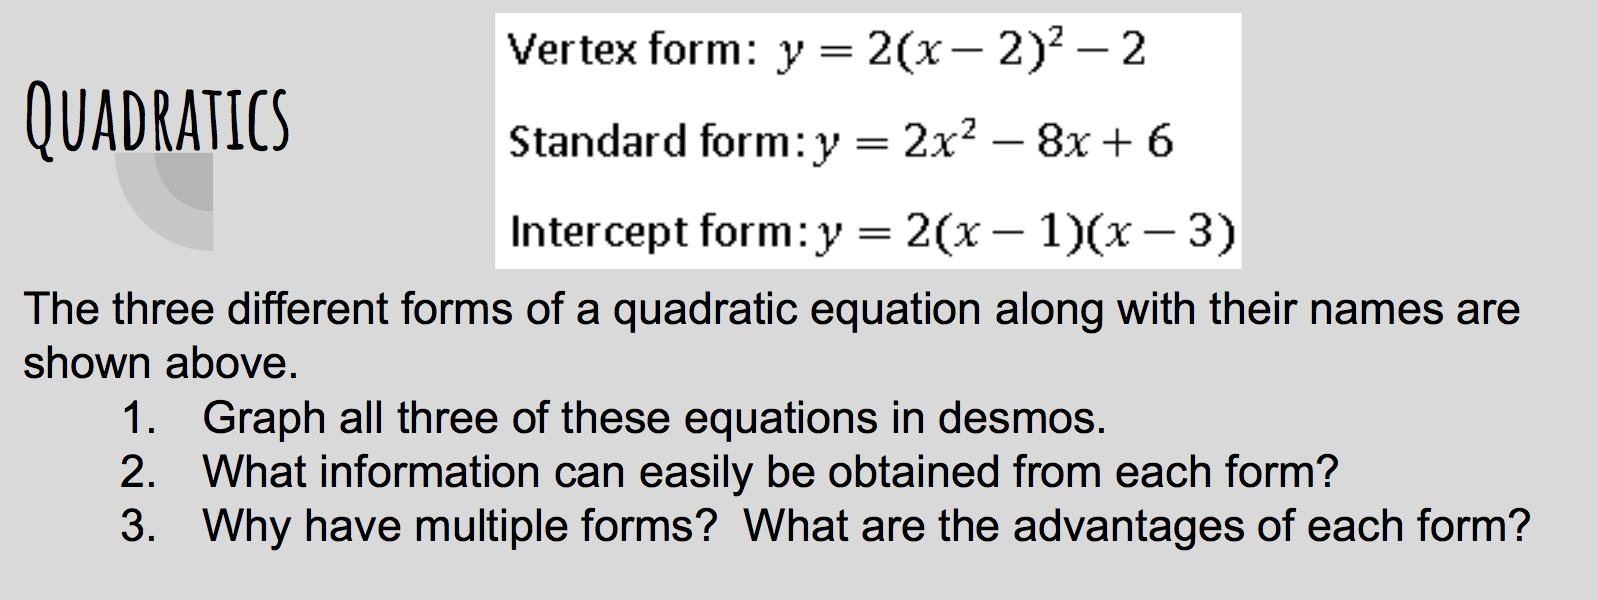
I have been teaching for quite a while and have taught units on quadratics more times than I can count. The concepts of vertex, line of symmetry, factoring, quadratic formula, and intercepts were frequently discussed, often times in more than one class. More often than not, when I was a 'section' teacher, I followed the current textbook's recipe on how to do this. The current textbook I am working with lays it out like this:
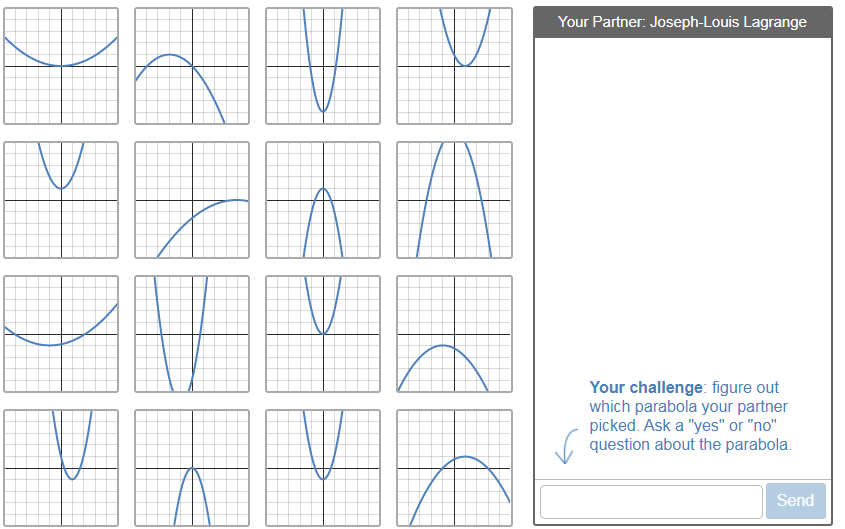
Many times at the start of this unit I would show the students how to graph basic parabolas - I would define the key items such as the vertex, line of symmetry, and intercepts, and then graph them. The students would copy what I was doing and then do homework problems essentially replicating this behavior. The students' thinking only went as far as the rote mechanics they were employing when finding the key items. As I approached this chapter this year, I was thinking about how to organize the lessons to best suit the students. It then led me to the question, 'How can I organize this unit so that I am able to leverage the 8 cultural forces described in 'Cultures of Thinking: The 8 Forces We Must Master to Truly Transform Our Schools' by Ron Ritchhart, in a way that helps students the most?' I have organized this blog post in to several days. Today I will cover day 1, with other days following soon. Day 1: Polygraph parabolas On this day, I wanted the students to speak the language of parabolas. Our foreign language teachers tell me that the best way for students to learn about the language is to speak it - so it seemed reasonable that the best way for students to begin to learn about parabolas is to speak about them. I decided to start the unit by using the "Polygraph Parabolas" activity on www.teacher.desmos.com. All the students need a computer and sign in to the activity after receiving a special code that Desmos generates. I decided to sign in as well so I could do the activity with them. When everybody signs in, Desmos pairs everybody up randomly. The opening screen of the activity looks like this:
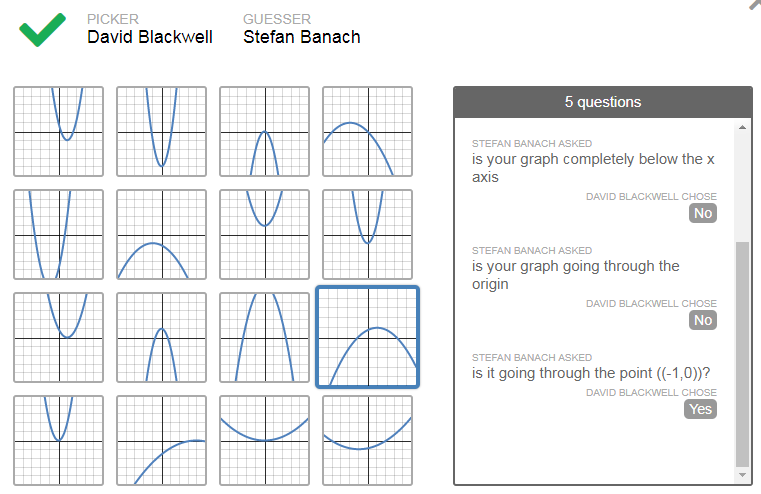
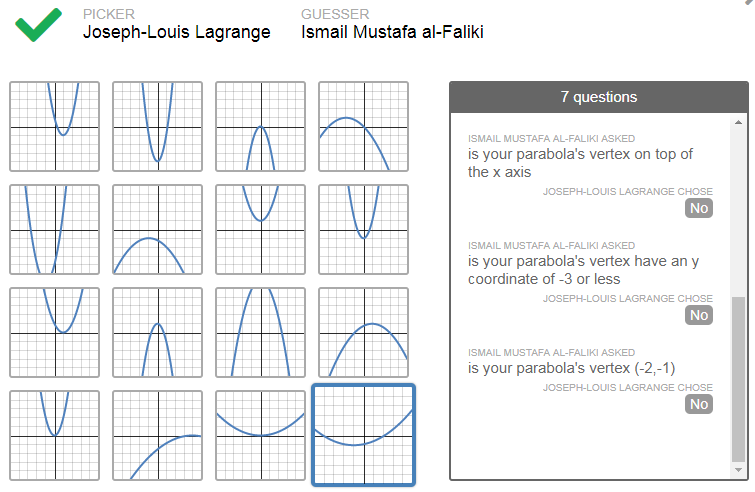
Student 1 of the pair chooses their 'favorite' parabola, and then Student 2 of the pair asks questions to try to figure out which parabola that Student 1 picked. Student 2 has to ask yes-no questions, and then Student 1 answers them. Take a look at the sample interactions below. One nice feature of desmos activities is you can anonymize the names so the students' real identities are hidden:
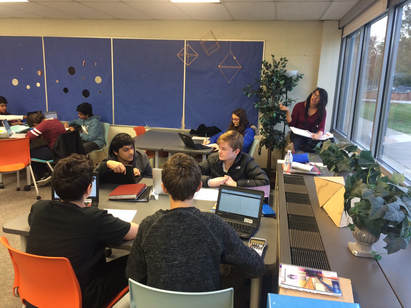 Students engaged in 'Desmos Polygraph: Parabolas' Students engaged in 'Desmos Polygraph: Parabolas'
As you can see from the above interactions, the students must use mathematical language in order to communicate with each other. I used this in more than one block, and the activity would start out very quiet as the students communicated via the computer as they typed in and answered their questions (much like they interact when texting each other). However, in every class, as time went on, the students began to interact with each other with live conversations. It was really awesome to see that unfold. I would hear things like "what do you mean by ...", "when you say the graph is positive, what do you mean exactly", and "when you say minimum, do you mean the vertex or another point?" The best part about this computer interaction and live interaction is the students were communicating with each other with mathematical language. At the beginning of the activity, the language was imprecise but as time went on it became more detailed and mathematically correct. The best part of it was when the students used their own language to start with, such as "x-axis crossing points" and "bottom point", and then to see it slowly transform into terms such as "intercepts" and "vertex."
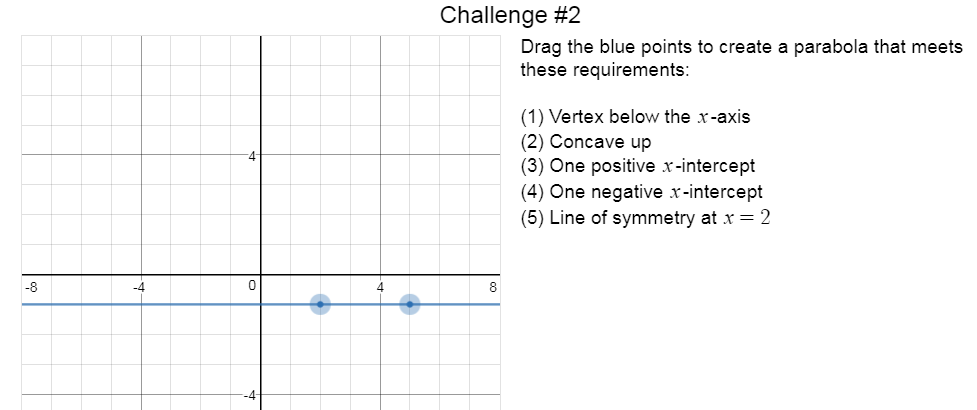
I let the students play this activity for about 30 minutes. After this, there is another desmos activity related to this called "Polygraph parabolas, part II" that I let the students explore. This activity takes some of the imprecise language, such as 'turning point', 'smile', and 'touches the middle line twice' into language such as 'vertex', 'concave up', and 'intercepts.' At the end of this activity, the students are asked to create parabolas with certain characteristics. Here is an example:
There are many cultural forces at play during this day in math class. Here is a look at some of them:
1. Language: The language of community is very evident as the students are creating the vocabulary that is used to communicate about parabolas. Often times during the course of the polygraph activity, students ask me 'is this the way to say it' or 'is this right?' My response is always 'are you able to communicate with your partner effectively with the words you are choosing? Perhaps you should talk with them and get the vocabulary ironed out. Later in the week we will see what other mathematicians have used to communicate, and we will also talk about why they might use the language they use.' This allows the students to have a sense of community and to see that math is not something that is defined outside of our classroom - rather it is something we develop as a community of mathematicians. 2. Modeling: By participating in the activity with the students, I tried to model that I am a learner with them and that I am not the sage of parabola vocabulary. I wanted them to see me as a role model instead of an exemplar. As they worked through questions about parabolas, I noticed the students leaning on each other to make sense of what was going on - they slowly became independent and confident in talking about parabolas. If I would have used transmission of knowledge as the mode of teaching on this day, students would have missed out on this rich activity and would have seen me as an exemplar instead of taking control of their quadratic vocabulary. 3. Interactions: It goes without saying that the Interactions were a big part of this day. Most students interacted with over half the class because when one partnership ends, desmos automatically matches the students up with somebody else that is waiting. As I said earlier, what started out as virtual interactions slowly turned into live interactions as the students were trying to sort out their thinking. 4. Opportunities: The best part about providing this opportunity for the students was that it was a low threshold opportunity - all students could participate. Some of the students already knew the 'perfect' parabola vocabulary, while those that didn't improvised by using words that made the most sense to them. Some students were using phrases such as 'bowl shaped', or 'smile' to describe a certain parabola. I think that was great. If I would have just told them to say 'concave up' instead of 'smile' it would have been my words and not their own. 5. Environment: The environment on this day was one of organized chaos. There was structure for sure as the students were at their computers and playing a polygraph game, but the overall atmosphere was one of curiosity, thinking, and laughter as the students tried to communicate with each other about a topic that was new to many of them. In upcoming posts, I will describe how to leverage Cultures of Thinking with the rest of the quadratics chapter. Later this week, I will cover what happened on Day 2: Marbleslides: Mapping the shape of a parabola to the equation that generates it. Please visit again!
2 Comments
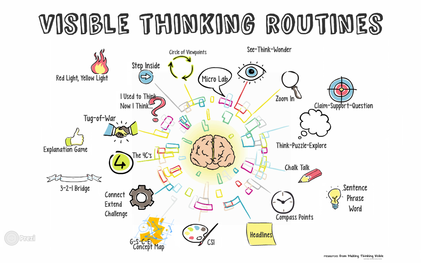
As I contemplated what to have the students do after their 'Polygraph: Parabolas' activity on Day 1 (see Day 1 post here), I needed to take inventory of what the students learned up to this point. I tried making a list, and then realized that it would be better if the students made the list instead. This led me to the new thinking routine, the '+1 Routine', under development for the Making Thinking Visible 2.0 book, which is under development by Ron Ritchhart and Mark Church of the Project Zero team at Harvard University.
The routine goes something like this:
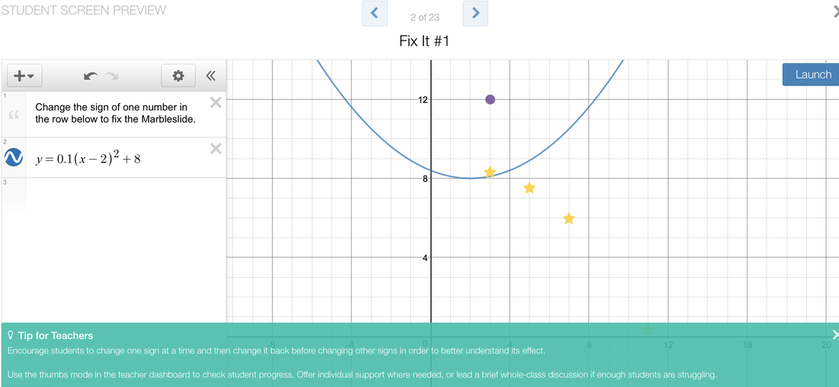
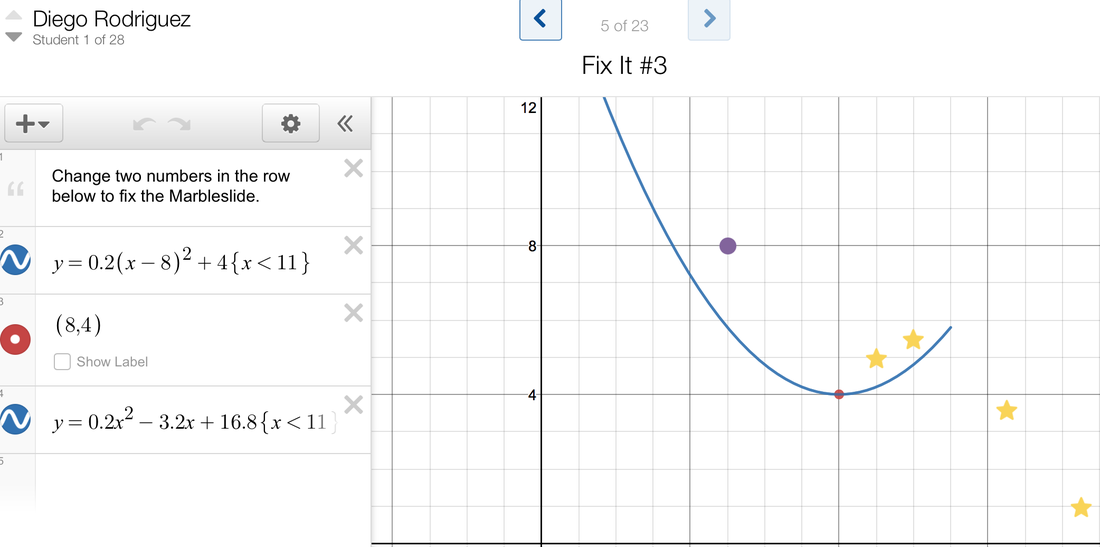
I had one person from each group read their list, and then I said the word 'popcorn.' This is a signal to students that I am looking for a comment or feedback on what was just read. The student that did the reading then called on a person of their choice to share their thoughts. The +1 Routine provided a great recap of the previous day's lesson, and sparked more of the vocabulary that I wanted the students to continue to use. Where did we go from here? The polygraph activity on the previous day involved only graphs of parabolas - the students did not see the corresponding equations that generated those parabolas. It seemed logical to me that they should spend time associating parabolas with the equations that generate them. This led me to the Desmos Marbleslides parabola activity. As you can see from the sample screen below, in this activity the students have to use the vertex form of a parabola in order to 'catch' stars with marbles rolling along the parabolic curve. They are given an initial curve, and then have to change the values of a, h, and k in order to get the parabola in a certain shape to catch all the stars. Once they feel confident that their shape will work, the students hit the "Launch" button which releases the marbles (the first marble is the purple dot) which 'hit' the stars. Once all the stars are hit, the student gets to move on to the next screen which is a new curve and a new set of stars. 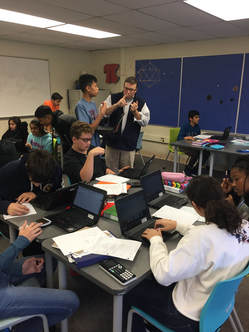 Students working on the Desmos marble slides activity. Students working on the Desmos marble slides activity.
After the students got a feel for the first couple of slides (teachers are able to pace the activity so students can only work on certain slides at one time), I paused the activity to give a new set of directions. I had them each take out a piece of paper and explained that they would be documenting their thinking as they went along. I felt it was important for them to do some additional thinking about what they were doing with desmos in this activity and to write it down. I have students record all of their desmos activities so they can go back to them later, but I also wanted to see some documentation of their thinking. I wrote the general form of the vertex form on the board, and proposed the following questions as they were going through the activity:
These prompts gave the students some things to think about as they changed the graphs of the quadratic equations. I gave the them time to complete more slides and think about the above prompts, and then explained that their home thinking due the next class was to finish the marble slides activity, and to answer the above two prompts. In the Day 3 post, I will discuss how the students converted between vertex form and standard form, and how they used Desmos to 'check' if their conversions were correct. Stay tuned! 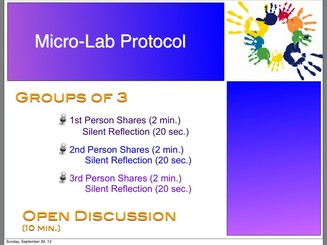 Microlab Protocol Microlab Protocol
The home thinking that the students had to do at the end of day 2 was the following:
The students turned in their documentation of their thinking as they walked in to class. I looked at it briefly, checked that they completed it, and then handed it back to them. I used the "Team Shake" app on my phone to generate groups of 3. I then asked them to run through the MicroLab protocol to discuss their thoughts on the values of a, h, & k (If you are not familiar with the MicroLab protocol Visible Thinking routine, see the image below). I displayed the slide to the right in class and did not have to explain too much because we had used it before. I just reminded them that as each person is talking, the other two needed to listen only. We ran through the protocol, and then I asked the groups of three to have an open discussion. After this I had the students go back to their home tables and to verify their thinking about the values a, h, & k, and then we had a class discussion about these values. As a final check for understanding, I had the students close their laptops and answer the following questions: I circulated around the class and looked over their shoulders at their responses. After about ten minutes I told them to open up Desmos.com to check their answers. I circulated and the students entered the 5 equations in Desmos to check the 'width' of the graphs to verify if they had them in the right order. Some of them had questions, which I addressed and overall the problem went well. The second question, though, was a different story. I thought it was going to go quickly. I thought to myself, "If you take 3x^2 and shift it left 4 units, you obviously get 3(x+4)^2 and you go on your way." The students had real trouble with this. Many of them wanted to add an x term and a constant term to get the graph to shift. Most students shifted the graph to the left, but not by 4 units. Some of them shifted it left 4, but then it moved up or down as well. I was puzzled as I thought since they had played with the equation y=a(x-h)^2+k in desmos, and tried different values, they would understand the connection. As I questioned more students and tried to get the big picture it was clear to me that they did not see y=3x^2 as possibly in vertex form. So, I wrote the equation on the board as y = 3(x-0)^2+0. Bingo! Lights on! They caught it immediately and went on their way. One of them said to me, "But I thought y = 3x^2 was in standard form?" Another responded to her saying, "It looks like we have an example that sort of fits both forms." Still another said, "What is standard form?" I laughed out loud, not at the kids of course. I explained to him that this was one lesson that did not go as I had scripted, but it was necessary because that is what the class needed.
After we got this squared away, I had them open the Marbleslides activity (they can log in so it is saved - see the sample screen below). I walked around and checked if they had plotted the vertex on their parabolas and they had, and asked them how they found the vertex. One student said, "I just looked at the graph and knew where the vertex was at and made a best guess on what the coordinates would be." I asked how many had did it this way, I about ten of them raised their hands. I said, "How did the rest of you do it?" One student chimed in, "I just looked at the vertex form, took the h and the opposite of k, and knew that that was my vertex. Then I plotted it."
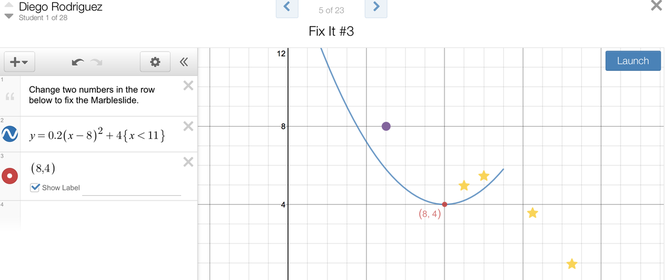
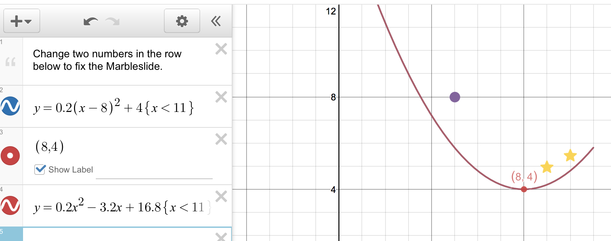
I said, "It sounds like we have two methods: one is looking at the graph, the other is to look at the equation. Which is better?" A student said, "I like looking at the graph and making a best guess. I'm visual" while another said that using the equation to get the vertex was more exact. I said that sometimes in math we have several methods to do things. However, I did mention that if they didn't have the graph in front of them to look at, that they needed to be able to use the equation exclusively to find the vertex. At this point I projected the marble slide screen shown above for the whole class to see. I then typed in a different form of the equation that was already there, but this time I put it in standard form (see picture below). I asked the kids what was happening here, and I made sure to give proper wait time. Here are a few responses:
I asked the class how many of them had familiarity with FOIL. Most of them raised their hands but there were some that did not. I wrote the conversion on a sheet of paper and when I was finished, I projected it on the document camera. I then asked them to take a couple minutes at their tables to read what I had written and to discuss it. I purposely put a mistake just to see if they would catch it. The discussions were rich as the students that remembered FOIL were explaining it the students that either never saw it before or forgot about it. The one comment that I took away from this was from a student that said, "I knew how to do FOIL, but I never knew why I was doing it." I then gave them their thinking for the rest of the class period and for home thinking for that evening:
Go to slides 2, 4, 5, 6, 8, and 10 in the marble slides activity and convert your equations from vertex form to standard form. Do the conversions on paper so you can get the mechanics down, and then plot your answer on the marble slides screens to make sure it completely matches the graph that is already there.
Before we embark on day 4, here is a quick summary of the first three days of the unit:
Day 1: The students used Desmos polygraph to discuss the vocabulary surrounding the graphs of quadratics. Day 2: We used the +1 Routine to generate all of our thinking about parabolas and quadratics. This led to the Desmos marble slides activity where the students wrote equations of quadratic functions in vertex form in order to generate graphs that 'catch' stars. Day 3: The students continued the marble slides activity by plotting the vertex on each page of the activity, converting the equations from vertex form to standard form, and looking at the 'wideness' and 'narrowness' of parabolas. I started the class with the following prompts:
I had the students read and think about the above prompt quietly for ten minutes. I then had them have a discussion at their tables. I picked up some of the things the students were discussing:
As a teacher, It's always hard not to step right in when you hear incorrect information, but I resisted, choosing to let the 'incorrect' stuff to hang out there for a bit. After about 10 minutes, I then announced: "Ok, in a moment you are going to have Watson time - a ten minute period where you can ask me anything you want. So, take a moment at your tables and come up with the burning questions that you just can't seem to answer amongst yourselves and jot them down. Take a moment...." This always sparks rich discussion as the students always want to use Watson time wisely. The funny thing is that they can ask me any questions at any point in time during class, at lunch, after school, or by email. However, when I set aside a block of time in class, they always use it as if it is an exclusive time to ask questions! Here are some of the questions that they came up with: Question 1 comes from Luke Luke: "Does intercept form mean x-intercepts or y-intercept?" Me: "What happened when you graphed it in Desmos?" Luke: "I didn't." Me: "Take a minute to graph it, jot down the intercepts, and then we can talk some more." <A couple minutes go by as I answer another question from a different student> Luke: "I graphed it. The y-intercept is 6. The x-intercept...I think there are two.....1 and 3?" Lizzy: "Yeah, there are two. Just take the opposite of the numbers in the intercept form and they are the x-intercepts." Me: "So, what do you think about your original question?" Luke:: "I forgot what it was.....ok, wait, I remember 'does intercept form mean x-intercepts or y-intercepts'. It should be called x-intercept form, it means x-intercept form." Saif: "Why do they call it that?" Me: "Who?" Saif: "The people that named it." Me: "Well, I got this name from a textbook and a website that talked about quadratics. They are mathematicians just like you - they chose a convention and it stuck." Question 2 comes from Angela Angela: "I like the vertex form because you don't have to show work to get the vertex. It's just right there. Do we have to show work on the test if we get vertex form?" Me: "Can you ask the question again but leave out 'on the test'? Angela: "Do we have to show work if we get vertex form?" Me: "Did everybody hear that question?" <a few students shake their heads no> Me: I reiterate something that I have mentioned time and time again. "Remember, this isn't just a discussion between me and the person asking the question. It's a discussion between all of us. Please repeat the question." Angela: "Do we have to show work if we get vertex form?" Me: "What do all of you think about that question?" Will: "Wait, show work when we are doing what with vertex form?" Angela: "If we have to find the vertex, and we get a quadratic in vertex form, do we have to show work to get it?" Me: "Can we have some opinions on this?" <Hands start to go up, and I give wait time> Will: <This student looks at me, but I redirect him to talk to the person that asked the question, so he does and they make eye contact with each other> "I don't think you need to show math work, the vertex is right there and that is the cool thing about that form - you can look right at it and get the vertex." Me: "How does that answer sound?" Angela: "I think it makes sense." Me: "Can we get some other thoughts on this?" Haden: "I would do the work anyway. FOIL it out and find it using the formula." Richard: "What formula?" Danielle: "Yeah, I remember a formula too. It's -b/(2a)." Me: "Okay, Danielle recommends a formula. Let's try it out. Open up your Desmos marble slides activity. You already plotted the vertex by looking at the graph and by looking at vertex form. Haden said we should use the standard form and then use the formula that Danielle is proposing. Haden, is the formula that Danielle remembers the same one that you remember?" Haden: "Yeah, I think that's it." Me: Okay, on slides 2, 4, 5, 6, 8, & 10, try the formula x = -b/(2a) and see if you get the x-coordinate of the vertex. After you try a few, go over to Haden and Danielle and see if what you are doing matches what they are doing." At this point, the class is headed in a new direction. I realize I broke my promise of "ten minutes" to ask me questions, but I think this is ok because the discussion led us this way and important points and concepts were brought up. The students work on finding the x-coordinate of the vertex for a while and many of them do not get the same value they currently see on their marble slides screen. Look at the sample marble slides screen below. 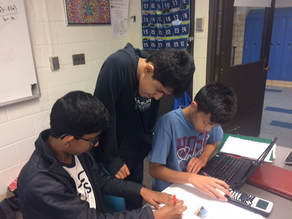 Students busy finding the vertex of a parabola using standard form. Most of the students 'knew' this material already, yet still had productive struggles on this day. Students busy finding the vertex of a parabola using standard form. Most of the students 'knew' this material already, yet still had productive struggles on this day.
Many students plugged in 3.2 instead of -3.2, which caused their value to be incorrect. They were able to self check, though, because the vertex is plotted for them on the screen. I surveyed the class and asked them how many were able to get the correct x value of the vertex using the formula. A group raised their hands, so I asked them to go to other students to check in with them to see why their values were not matching.
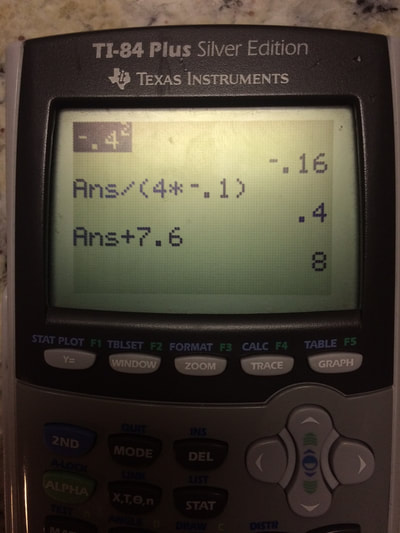
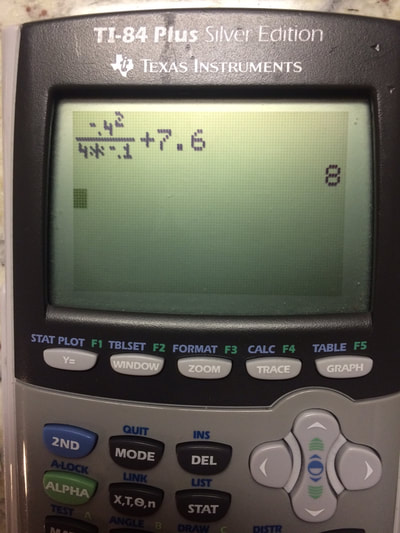
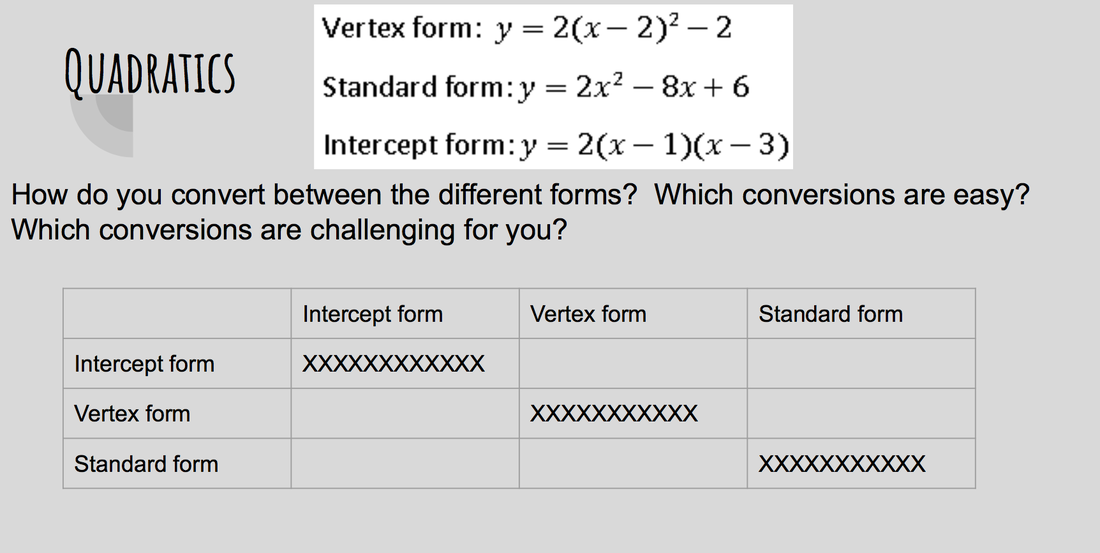
After a while, I ask how many of them had seen the x=-b/(2a) formula before that Haden and Danielle proposed. All but two students raised their hands. Twenty-six out of twenty eight had done this before, but there were a good number that were not successful in getting the correct x-coordinate. I then asked if any students knew how to find the y coordinate of the vertex. Several students raised their hands, and I ask them to form a group and talk over their methods, and to put any and all methods on the side board. What is interesting is that some students just plugged in the x value to the original equation to get the y-coordinate of the vertex, while other students used the formula y=-b^2/(4a) + c. At this point we have two 'competing' methods on the side board (unfortunately I didn't take pictures of this math work). I ask the class for their attention at this point: "Okay, please put your pencils down and close the laptops just so we can focus on something else. Everybody look at the side board.....can we put our pencils down and close the laptops? Let's look at the side board. Now read through the methods you see and first seek to understand what is going on." At this point the students read the side board for several minutes. I then hear chatter as they try to understand what is happening. As students start asking questions, I direct them to the students that wrote the work on the board. Those students head to the board and explain their processes. I then say, "I think it might be a good idea if we all go to slide 5 and try to get the x and y coordinate of the vertex using the methods we discussed. Why don't you try both methods to get the y coordinate and see which method you like better?" This takes a good amount of time as some students struggle through the mechanics of finding the vertex. Several students finish quickly, so I ask them to wander and help others. At this point in time, class time is about over. I realize this is not at all how I planned for things to go (I planned on having them convert between the different forms of quadratic functions), but the quality discussions and learning they were doing made it too valuable to get upset about keeping to my schedule. This is material that we were going to cover anyway, it was just moved forward based on the needs of the class. I then ended the class. "Wow, we definitely accomplished a lot today. This is not exactly what I had planned today, but I think this is what we needed at this point in time. So, for home thinking for next time, find the vertex of the equations on the rest of the slides by using the formulas proposed today. Let me know how it goes." Please check back soon for Day 5! I will be discussing the results of finding the vertex, and then move on to converting between the different forms of a quadratic. If you would like to subscribe to this blog, sign up on the upper right of this page. Happy reading! Before we embark on day 5, here is a quick summary of the first four days of the unit. Click on each day if you would like to read the entire post: Day 1: The students used Desmos polygraph to discuss the vocabulary surrounding the graphs of quadratics. Day 2: We used the +1 Routine to generate all of our thinking about parabolas and quadratics. This led to the Desmos marble slides activity where the students wrote equations of quadratic functions in vertex form in order to generate graphs that 'catch' stars. Day 3: The students continued the marble slides activity by plotting the vertex on each page of the activity, converting the equations from vertex form to standard form, and looking at the 'wideness' and 'narrowness' of parabolas. Day 4: Students looked at three different forms of a quadratic: intercept form, standard form, and vertex form. They had a discussion on what the benefits were of each form. We then began to explore how to find the vertex using the standard formula (-b/(2a), -b^2/(4a)+c). Students were having more trouble with this than expected as they were having trouble dealing with the negative signs in the formula. They could easily self check their vertex as it was already plotted on their demos slides, but many of them were not getting matching answers. For their home thinking that was due today, I had asked the students to manually find the vertex for each of the parabolas in the Desmos marble slides activity and to check their answers as they went along. Each student logged in to their Demos marble slides activity and had it showing on their computer screens, with the home thinking that they created sitting out as well. I used the Team Shake app to mix the class up in to pairs and gave them five minutes to discuss the results of their thinking. I walked around and answered various questions about finding the vertex, looking at the math work as I went. Some students were still having trouble simplifying correctly, while other students had mastered the concept. I then had a discussion with the class about doing more practice with this concept. It went something like this: Me: As I was walking around, I noticed that some of you are still practicing and playing with this concept, while some of you seem to be getting the correct vertex every time. If you are finding that you can't get the vertex every time, then you may need more practice. Each of you has to decide where you are at and if you need more practice. Student 1: Mr. Watson, are there other practice problems that you can give us so we can find the vertex? Me: I do have worksheets made up, but do you really need them? Student 2: It would be nice to have. Me: Let's suppose Moodle is down, though, and you can't get to the worksheet that is loaded on there. What could you do instead? Student 3: We could generate a bunch of parabolas in desmos.com, like we did with the marble slides activity, and then try to find the vertex for each by hand. Me: Sounds like you would have an infinite amount of examples to pick from, plus you would have the answers right there. Student 4: Yeah it would be good to have the answers because that one time you forget to post them and I waited around and they never showed up. <The class and I all laugh at this comment> Me: Yeah, it's better to rely on yourself for the problems and answers than to wait for an old teacher like me <laughter here> At this point I present the class with the following pictures of two different calculator screens: I then pose this question to them: "Take a look at the calculator screens that I have put up on the overhead. Take a minute and process what you are seeing here. Think about what is happening on each calculator screen and be ready to discuss." The students thought for several minutes. I realized after we did this that it would have been a perfect moment to have the students do a 'See-Think-Wonder' routine; this is essentially what we did, though, but with different words. I asked the students for some input and gave appropriate wait time. The students chimed in and realized that what they were seeing was the calculation of the y coordinate of the vertex, done two different ways. I then asked them which solution was 'better.' This part surprised me, as most of the students chose the picture on the left. Here were some of the comments: "I would pick the one on the left because it makes more sense to me" "The one on the left makes you think about what you are doing" "The left one is easier to see what is going on" "The one on the left gives you the steps, but the one on the right is quicker. So, if you know what you are doing, do the one on the right; if you are still learning it do the one on the left." For years, I didn't give the students a choice in the matter. I made them calculate the y-coordinate using the screen on the right because I thought it was easier and cleaner; I didn't consider their viewpoint in that the steps made more sense to them if they entered it like the screen on the left. I left this activity pleasantly surprised because their response to this was not at all what I had expected. A student then asked, "Well, which one do you want us to do on the test?" My reply was, "Well, can we ask that question but leave off the phrase 'on the test'?" The student replied, "Well which one do you want us to do?" I said, "Which one makes better sense to you?" She said, "The one on the left for now, but maybe the one on the right." My response was "well, do the one that make the most sense to you. As mathematicians, there are many ways to do the same thing, and we sometimes need to do what we are comfortable with." I then showed the following slide to the class. I gave them a minute to read it and then asked if they had questions on what they were expected to do. One question that was asked was: "What do we put in each box in the chart?" I said, "Each box is a process in and of itself. Each box will most likely take up a good portion of a sheet of paper or a white board. Feel free to use chart paper, loose leaf paper, a small white board, or one of the large white boards on the wall. It is time to dig deep! One recommendation: start with the vertex form to standard form cell, and then go from there." The next block of time, over 30 minutes, was one of organized chaos! Students were all over the place in the classroom: some chose to work with pencil and paper, some used small white boards, some stood at the classroom white board, others were using the computer to look up items on the internet. At one point, a group of students was standing around a laptop and when I went over they were watching a Khan academy video about completing the square. I asked them what they were watching and they said that they had read that to convert from standard form to vertex form, they needed to complete the square, and they wanted to see what it was. Now, I knew that completing the square was not a focus of this unit and it would be something that they would do in later years, but for now I did not want to extinguish their energy and excitement.
As I kept listening to the class, I heard things like 'foil', 'simplify', 'completing the square', and 'factoring.' I was excited to hear these key words and phrases. One pair of students were 'arguing' over one of the conversions because one of them entered it in wolframalpha.com and the other on symbolab.com and they got different answers. One student came up to me and our conversations went something like this: Student: "Mr. Watson, I think I know how to convert from vertex form to standard form, but I'm not sure what to call it." Me: "well, what is it that you did to do this?" Student: "I used foil and then made it simpler." Me: "well, that sounds like a good way to describe it - let's go with that and we can see what the class thinks later." Student: "We haven't spent any time on this, have we?" Me: "Remember when you did the conversions in desmos last week? And you checked them?" Student: "OHHH!!!! That's what we were doing when we were doing that. It makes sense now!" This made me laugh as this particular student finally made the connection of something we were doing a while back. This type of thing used to irritate me before, but now I accept that learning is a process and different students process and master things at different rates. Class was nearing the end so I asked the students to pick two conversions that they felt the most comfortable with at this point in time. I asked them to find two quadratic equations and convert them accordingly for our next class. Please stay tuned for Quadratics Day 6, where we will fill in the conversion chart, which will naturally lead us to foil'ing as well as factoring! |
Archives
February 2021
Categories
All
AuthorJeff Watson is a Math teacher at the University Liggett School in Grosse Pointe Woods, MI. His work as a software engineer made him realize the need for problem solvers and critical thinkers in the workplace today. Jeff believes that the secondary math classroom should be a place of critical thinking, collaborative learning, and exploration which will cultivate the problem solvers and thinkers needed today. |


 RSS Feed
